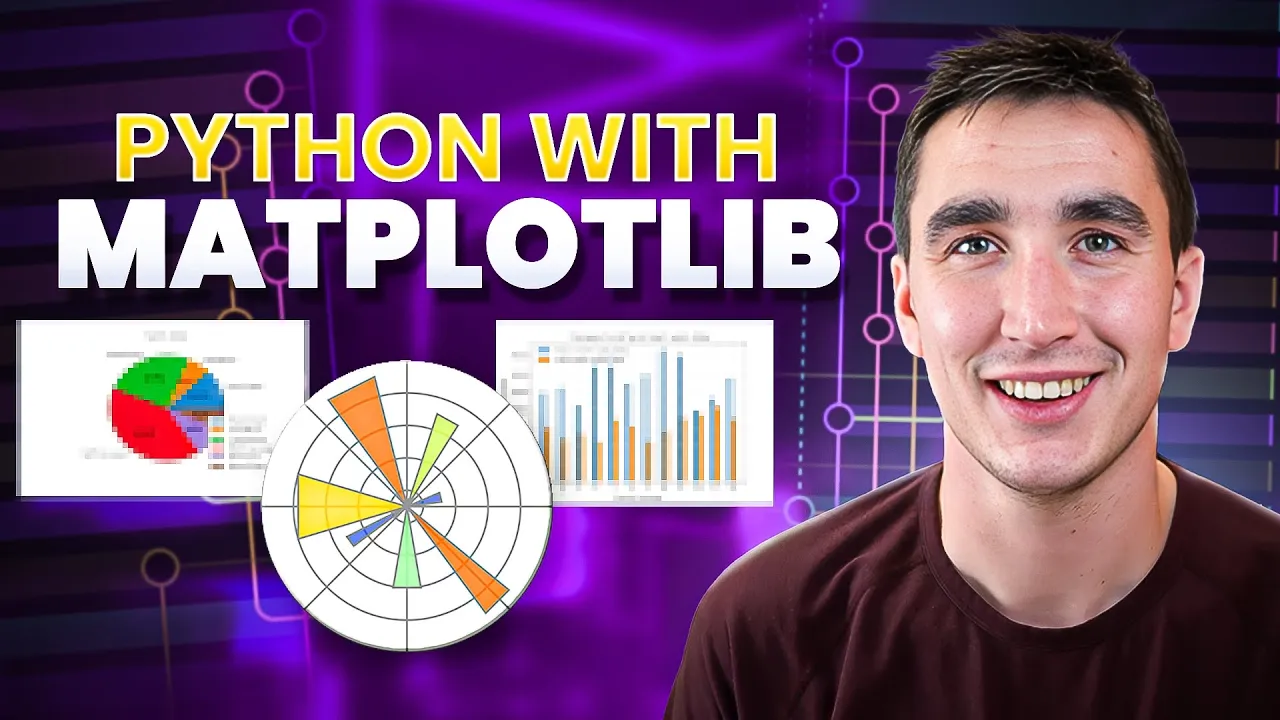
Intro to Data Visualization in Python with Matplotlib! (line graph, bar chart, title, labels, size)
Keith Galli · 284,6 N lượt xem · 1 thg 6, 2019
Mô tả
Practice your Python Pandas data science skills with problems on StrataScratch! https://stratascratch.com/?via=keith
Join the Python Army to get access to perks!
YouTube - / @keithgalli
Patreon - / keithgalli
Yay finally posting again. Hopefully this video will help you get comfortable working through the matplotlib library. I'm going to post a follow up video with real-world examples (combining pandas with matplotlib) and different types of plots next week. I originally was going to include that in this one, but I thought the video was getting a bit too long.
In this video we walk through some of the basics of matplotlib. We start by making a simple line graph. We learn how to give the graph a title and label the x & y axis. We learn how to scale the graph by specifying the x & y tickmarks. After this, we restyle our line by passing in keyword arguments then do basically the same thing with a shorthand notation. We resize our graph and save it. Then we end with a simple bar chart.
Source Code (includes code and data for next video as well):
https://github.com/KeithGalli/matplot...
Matplotlib Pyplot Documentation:
https://matplotlib.org/api/_as_gen/ma...
Font List:
http://jonathansoma.com/lede/data-stu...
Install libraries Needed for this video:
Option 1:
Open up a terminal window and type
pip install matplotlib
pip install numpy
pip install pandas
Option 2:
Download anaconda which will contain all the packages we need. A video on how to do this is here: